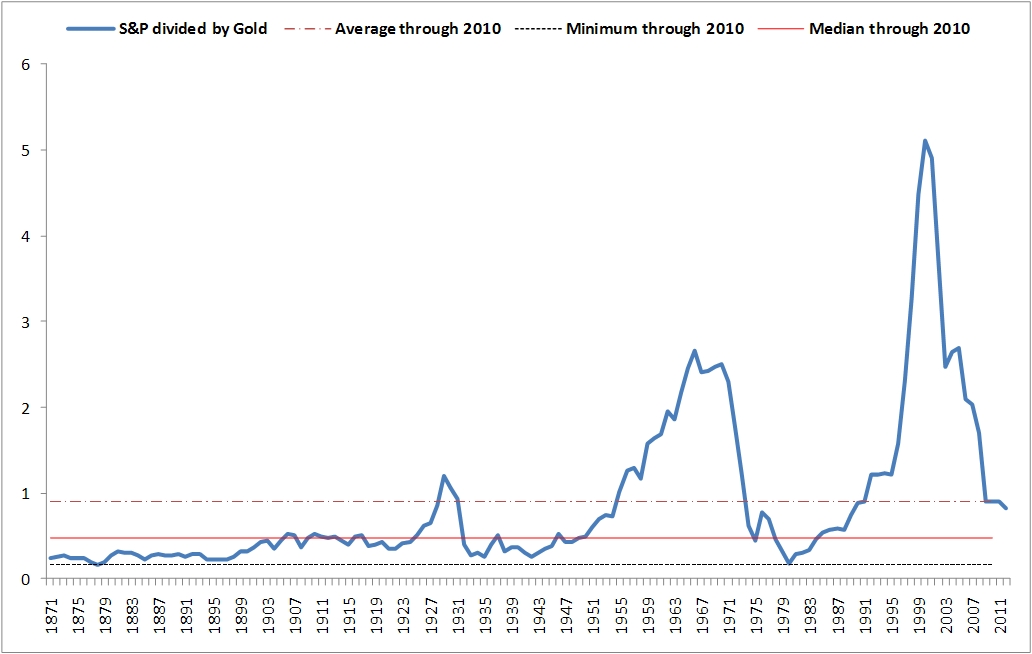
Three peaks on the chart: 1929, 1966, and 2000. After each peak, there was a decline and period of time until the ratio began climbing again.
After 1929, the climb didn't start again until 1941 - about 12 years. After 1966, the climb didn't start until 1980 - about 14 years. Since 2000, it has been 11 years and I'm not certain that the bottom has been made.
I look at this chart, and I tend to think the ratio of S&P to Gold will probably decrease some more - at least to the median of 0.48 (as shown by the solid red line). Mathematically, there are plenty of combination to reach the 0.48 level, but all of them mean that Gold would have to at least double the S&P.